We make over 100 Swiss banks comparable.
bankenkompass turns audited annual reports into key figures, in the context of your bank and its peer group. Every figure links to the report page it comes from.
One app, four layers
From a quick read of the market to a citable exhibit for the board.
Insights
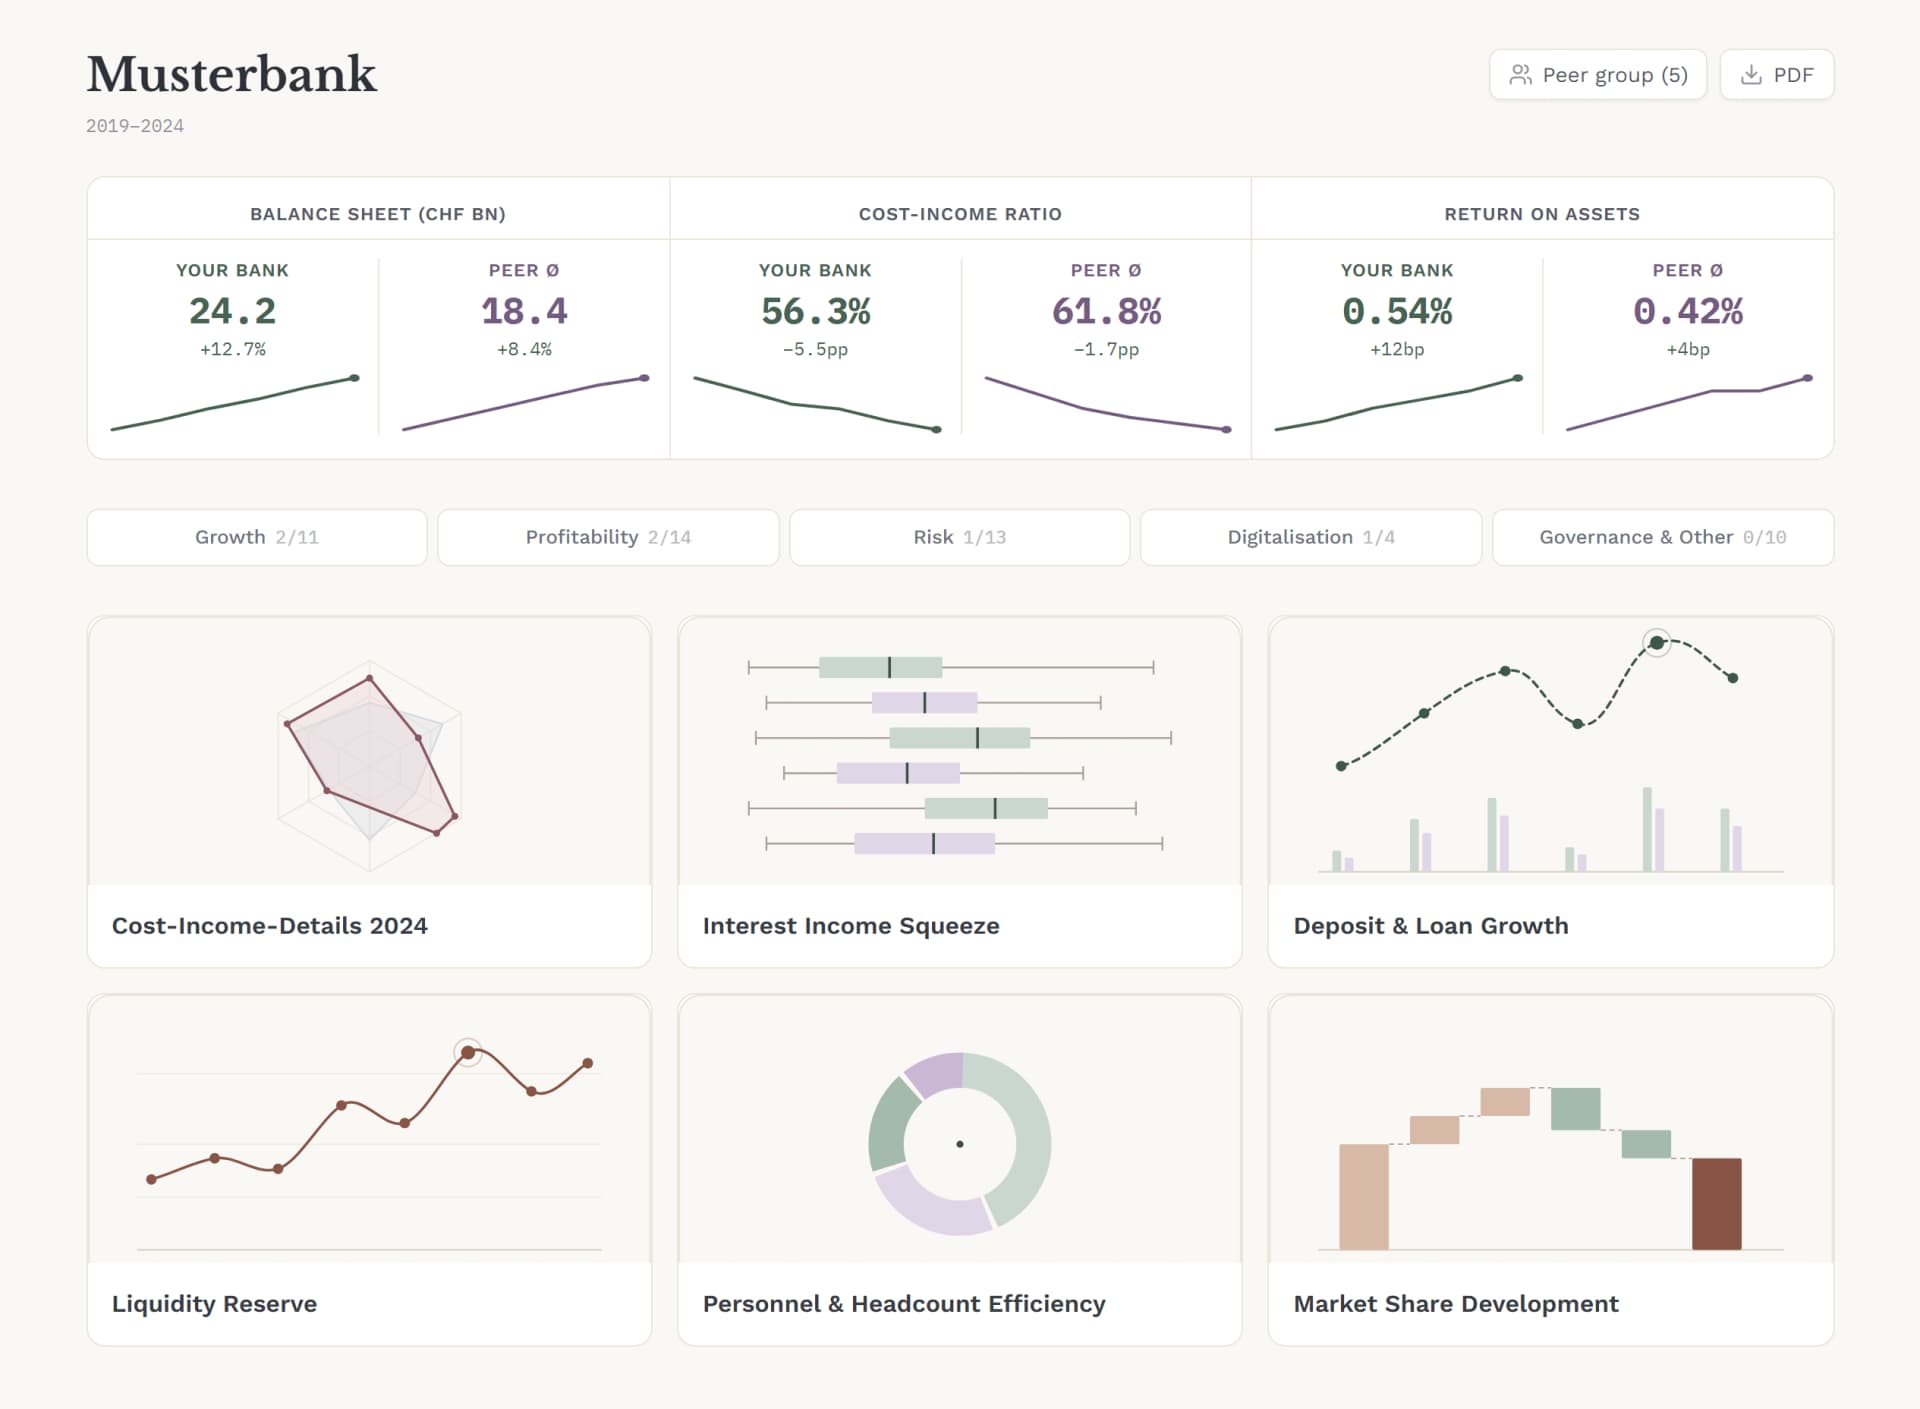
Your bank's efficiency, income structure and growth in peer comparison.
Analysis
The full financial statement as key figures, filterable by type, region and size.
Studies
53 sector studies, read against your numbers: what concerns your bank and what doesn't.
Reports
Your bank report in five chapters, as a link you can share.
Compare a bank – right now, no login
Pick a bank and see its cost-income ratio against the entire Swiss market. A slice of the app, with real figures.
From annual report to benchmark
Eight steps from the published PDF to a validated figure. Every number stays traceable to its page in the annual report – you open the source directly in the comparison.
- 01
Find annual reports
Our web tools find every published annual report automatically
- 02
Load PDFs
Each report is loaded as a PDF – the original pages are preserved
- 03
Read pages
An AI reads every page of the report
- 04
Detect tables
Income statement, balance sheet and notes are detected automatically
- 05
Extract positions
Every line item from the report is stored in structured, traceable form
- 06
Normalise data
Differing charts of accounts are brought onto one common standard
- 07
Validate figures
Seven automatic checks per report – flagged values are reviewed by a person
- 08
Build peer benchmarks
The validated figures become comparisons against the right peer group
It ends in your report
Validated figures, peer comparisons and the source behind every number – in one document.
Time series
Every figure across several financial years.
Peer comparison
Your bank against its comparison group.
Source pages
Every value leads back to its report page.
Latest analyses from the data
Publicly accessible, no login. Every analysis rests on the same validated figures as the app.
Efficiency and size: the cost-income ratio of all banks
The interactive scatter across the entire market. Which banks operate efficiently — and what drives it.
Open analysis →Digital investment: what banks spend on software and ICT
Spending trends across all bank types, and whether the investment shows up in efficiency.
Open analysis →Interest, commission, trading: how income is composed
Cost and income structure in interplay — the composition of revenue sources, bank by bank.
Open analysis →Who works with bankenkompass
Executive Board
You justify your strategy to the board and need the citable figure with its source. No project, no setup.
Strategy & Projects
You build peer comparisons that used to mean combing through reports by hand. Filterable peer groups, every metric transparently defined.
Consulting
You need credible market context for the next mandate. Report links to share, sources to verify.
What access costs
Three tiers on the same underlying data. Scope and price are stated here; for Strategic the engagement sets the scope.
Start with the sample analysis
You receive a sample analysis of your own bank, at no cost and without a contract. You then decide on one of the three tiers.
Essential
For banks that read their core metrics against a peer group.
CHF 3'500
per year
- Core KPI set (12 metrics)
- 2 saved peer groups + bank-type filters
- Studies library
- Refreshed with every report publication
Professional
For banks that run the comparison themselves and use the deep-dive modules.
CHF 12'000
per year and bank
- Everything in Essential
- Unlimited peer groups
- Bank-vs-bank comparison
- The six deep-dive modules
Strategic
For questions that need their own analysis. The scope is defined per engagement.
CHF 5'000–15'000
one-time per engagement
- Custom analyses
- Raw-data export
- Custom peer universes
- Consulting at CHF 1'800/day for subscribers
Scope compared
| Capability | Essential | Professional | Strategic |
|---|---|---|---|
| Core KPI set (12) | included | included | included |
| Additional metrics and deep-dive modules (6) | not included | included | included |
| Bank-type filters (5 standard) | included | included | included |
| Saved peer groups | 2 | unlimited | unlimited + custom cohorts |
| Bank-vs-bank comparison (2–3 named peers) | not included | included | included |
| Studies library (53 curated public studies, read) | included | included | included |
| Multi-year trends (2020–2025 in app) | included | included | included |
| Data refresh | per published report | per published report | per engagement |
| Board-ready report export | not included | included | + custom report packages |
| Alerts and watchlist | not included | included | included |
| Custom deep-dive analyses | not included | not included | CHF 5'000–15'000 one-time |
| Consulting | not included | not included | CHF 1'800/day (CHF 2'400+ standalone) |
| Raw-data access / export | not included | not included | by contract only |
Ten years of data held, six years in the app.
How access is set up
- 1
Request an offer
- 2
Offer within 2 working days
- 3
You sign
- 4
Activation
All prices in CHF, excluding VAT.
Frequently asked questions
See your bank in peer comparison
Request the free sample analysis: your bank against its peer group, on validated figures, in your inbox within 24 hours.
Let's talk about your needs
Whether a single analysis or full access: write to us — we reply personally.